
Consulting, convening, coding, covering new ground, plus occasional commentary.
coding
The making of CADIVI Abierta
A look inside a data bootcamp & a PDF data-liberation workflow
(Scroll down to continue reading)
It’s hard for me to believe that it has been almost six weeks since cartographic whiz Hugh Stimson and I were in Venezuela delivering data journalism workshops organized by the press freedom monitoring organization IPYS. It seems like only hours after we departed the violence in Venezuela was headline news around the world and we started hearing from the workshop participants about the rapidly escalating political situation on the streets throughout the country.
Hugh and I will be delivering that same bootcamp-style workshop again on June 7th & 8th in Vancouver as part of The Tyee’s Master Class learning series. Fine-tuned for the needs of data-hungry journalists, researchers, activists and anyone with a story to tell in British Columbia, and Canada more broadly, the two-day hands-on workshop will guide participants through the entire workflow of their own data project. Like in Venezuela, the workshop will conclude with participants presenting completed projects.
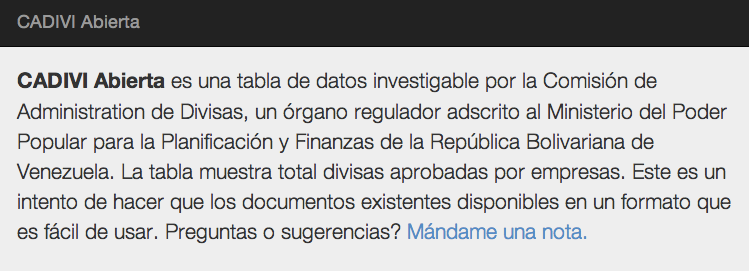
To give people a sense of what that experience looks like, I’m going to share the process that Venezuelan investigative journalist Emilia Diaz-Struck and I went through to take records acquired from the Venezuelan government body CADIVI (Comisión de Administración de Divisas/Commission for the Administration of Currency Exchange) – originally a 150-page PDF document with more than 10,000 rows of data – and make it available as a simple, searchable online “database”.
The project started simply enough as something we had tried to squeeze in between presentations, sleepy-eyed travel, and late-night conversations about politics and journalism. In light of the upcoming data bootcamp, and the unfolding events in Venezuela, I took some time last weekend to polish it up and write it up so that we could share it with you.
The PDF in question documents the companies in Venezuela that have asked to buy US dollars through the official exchange system that was put in place in 2004; it describes both the number of requests made over the last decade and also the number of requests fulfilled and the amount of US dollars purchased.
Searching for data
Finding the data was probably the easiest part of this project because data-savvy journalists in Venezuela have been sensibly making copies of whatever data the government releases, predicting that it might not always be available in the future. During the workshop, Emilia delivered a tour-de-force of how to find data online using site-specific searches and other tricks (all available in Spanish here), demonstrating how to search for information about companies that receive government contracts on the Servicio Nacional de Contrataciones site and about those same companies, or their executives, in the Venezuelan legal system. We put some of these ideas together in the final version of CADIVI Abierta, making it easier to search for related records right from the company listing. The PDF that makes up the listing is downloadable from the CADIVI site here or – if that’s not available – on Github here.
Extracting the data
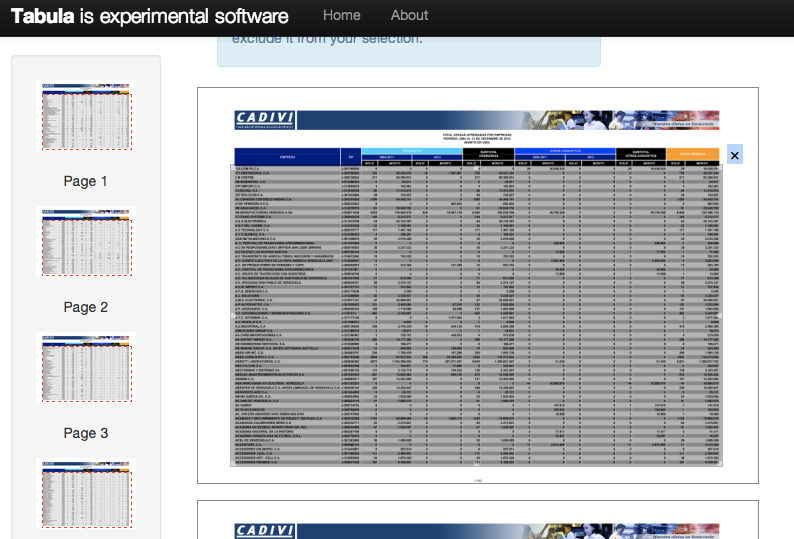
The next step was to pull the data out of the PDF and into a more manipulation-friendly format. Given that this was a 153-page PDF that was easier said than done. Historically, this might have required a Herculean effort, but today – thanks to the work of Manuel Aristarán and the others working on Tabula – it was as straightforward as highlighting the table in question and choosing “repeat area” and waiting for the process to finish (about an hour, if I recall correctly, to churn through all the pages). The end result was a 10,000+ row comma-separated values (CSV) file that we then uploaded to Google Spreadsheets. This was precisely the problem that Tabula was developed to address, and it did so with impressive accuracy.
Cleaning the data
As accurate as software like Tabula is, it’s also inevitable that there will likely be artifacts of the conversion from PDF to CSV that need to be cleaned up. This step, without question, required the most time and effort. Checking 10,000+ rows of data by eye was going to require more time than we had available, so we turned to a few data-cleaning tricks to make our spot-checking as efficient as possible.
It’s important to note that while working with the data we would make a new copy at every stage with a descriptive name – generally considered a best practice – so we had a history of how we’d worked with the data. In hindsight, given that it was CSV-type data that we were working with, this could have just been done using Git & Github, thanks to Github’s CSV rendering capabilities, with clear commit messages as to what was done at each step.
The biggest cleaning challenges we faced came from differences in numerical formatting: the PDF in question uses periods as the thousands separator and commas to denote the decimal position (the opposite of what you come to expect working in Canada and the US). The formatting issues were cleaned by opening the document in Open Office Calc, which I generally find to be better at data cleaning than Excel on Windows or Numbers on Mac, and using its Find & Replace with regular expressions. Similar transformations could have been done in Open Refine, but I generally find Open Office faster for simple work.
Checking the data
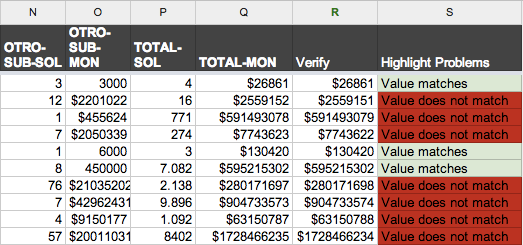
The next step after our clean-up work, given that we couldn’t check the entire data set by eye, was to make an effort to confirm that the data was still accurate. To do that, we made use of a conditional statement in Google Spreadsheets as well as conditional formatting to verify at minimum that each row still added up correctly. Rows that didn’t add up were highlighted in red, making it easy to check those rows and make adjustments if necessary. You can see this technique at work in the Google Spreadsheet here in column “S” called “Highlight Problems,” and you’ll note that a rounding error is the culprit for the remaining red rows.
The other issue was related to the extraction of the RIF (company ID) column from the PDF, where extraneous characters had slipped in from the extraction step. Again, knowing what format the RIF should take – single letter followed by a hyphen, followed by a string of nine digits – these errors where quickly highlighted using the same approach described above and cleaned by hand.
Success! Now what…?
At this point, we had 10,374 rows of clean data describing how many requests companies in Venezuela had made to buy US dollars, and how much they had received. Now what? A quick search for CADIVI on Twitter will illustrate just how contentious this system of currency control is, so it wasn’t a stretch to believe that making some of that information available online in a searchable and sortable format might help people to understand how it works, which companies are able to exchange Bolívars for dollars, and so on.
However, we didn’t want to stop there. Being able to search, sort, and filter the list is helpful, but we wanted to help users to quickly assess if there is a connection between the companies that are approved to exchange Bolívars for US dollars and, say, companies that are approved government contractors, or companies that are involved in some legal proceedings. To do this, for now, we’ve simply added links in the table beside the company name and ID number that enable a user to quickly open a new window with a pre-defined search for the company name in the Tribunal Supremo de Justicia, or by the company ID in the Servicio Nacional de Contrataciones. The next steps would be to scrape information from those sites specifically and, when there’s a relevant or interesting match, to present it directly in the table for further investigation.
Publishing the data
Like many, over the last six years I’ve come to rely significantly on the incredible tools, infrastructure, and spirit of collaboration that Github provides (at no cost to public projects). Add to that infrastructure the convenience of a static site – something I’ve written about before – and you’ve got a top-notch “stack” for rapidly developing prototypes and even for publishing straightforward Web apps. I’ve made a personal commitment this year to explore how far ideas like the NoCMS movement and static Web apps can go.
Thus, knowing that the CADIVI data for 2004-2012 was not likely to change, it was an easy decision to use Github plus a static-site generator to quickly mock-up the data table locally, and then to deploy it publicly.
I started with a very basic version by outputting the CSV file to an HTML table and then experimented with various JavaScript libraries to add the sorting and filtering and pagination. However, the statically rendered HTML table, given its size, proved to be very slow to load in most browsers, and even slower for the libraries to parse and enhance. An hour of Internet research later and I was experimenting with the DataTables plug-in for jQuery, which had the convenient feature of loading data from a JSON data source as well as deferred rendering to speed up the initial display of the table. A quick script later and I had a handful of JSON files for the various data sets that I wanted to show in the table.
The last step was to mix in a bit of Bootstrap CSS magic to make things look prettier, and to provide quick access to some subsets of the full data table, which can be a lot of information to parse visually on first glance.
Conclusion
Hopefully, this gives a sense of the workflow behind a small-D “data liberation” project, and how a typical two-day data bootcamp can unfold. If this type of thing interests you and you live in British Columbia, you should consider joining us on June 7th & 8th in Vancouver for a two-day data boot camp, organized by The Tyee and in partnership with Langara Collage.
I was spurred to complete this write up of the process behind the CADIVI Abierta for a couple of reasons: One, it appeared as if the official site and all of its data had become inaccessible. However, I’ve since heard that some in Venezuela are still able to reach it, so it may just be a temporary problem.
Second was recognizing that Venezuela’s president, Nicolas Maduro, had recently announced that the CADIVI system would be replaced with something else. Knowing that process might be underway, it seemed like a good time to let folks know that the existing data is still available. Emilia said recently “I think that is going to be very useful,” and I hope she is proven right.
Let’s face it, sometimes it takes people on the streets before things start to get moving again.
Got your own data liberation story? Drop me a note on Twitter or here in the comments.
About
Hi, I'm Phillip Smith, a veteran digital publishing consultant, online advocacy specialist, and strategic convener. If you enjoyed reading this, find me on Twitter and I'll keep you updated.
Related
Want to launch a local news business? Apply now for the journalism entrepreneurship boot camp
I’m excited to announce that applications are now open again for the journalism entrepreneurship boot camp. And I’m even more excited to ...… Continue reading
Previously
E-mail is alive and well, reports of death exaggerated.
From the future
Tips for living & working remotely